


February 11, 2014
The Bean Game was a really useful HCD method when getting rural farmers to describe what happens to their harvest.


As we talked to more and more farmers about their food spoilage problems, there came a point where we had trouble understanding just how much of their crop goes to waste. We’d talked through it a few times but wondered if there were another way to learn. So, taking a page from the human-centered design hymnal, we decided to get visual.
Enter the Bean Counters...
What We Did
The goal here was to understand what portion of the farmer’s crops went to market, what percent went to feed them and their families, and what percentage spoils.
What You’ll Need
This one is pretty easy. We only had a sack of pinto beans and a notebook or cloth on which to spread them around.
How to Do It
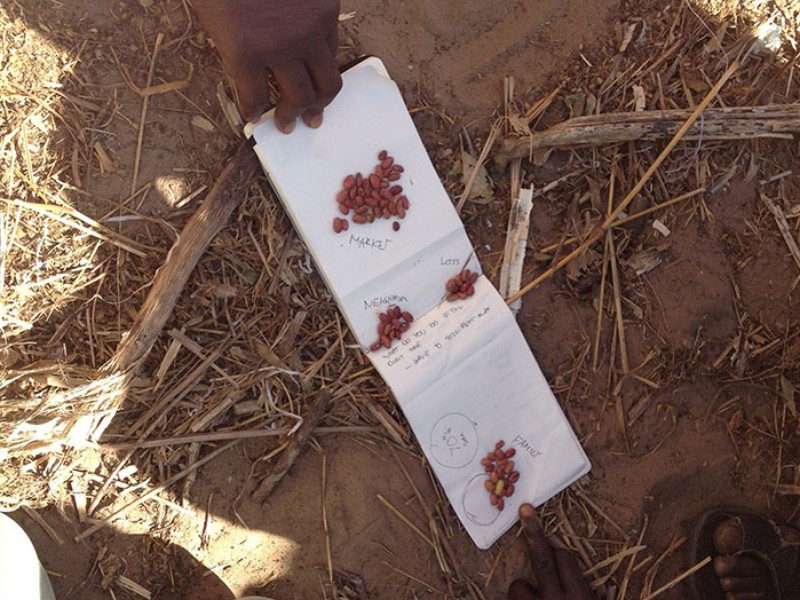
Just put a mound of say 75 beans in a pile and ask the farmer to group them into smaller stacks to represent how much of the harvest is consumed by his/her family, how much is sold, and how much goes to waste.
What We Learned
Though we got a great visualization of what percentage of crops spoil, we also learned that there was one category that we didn’t even know about: crops that go to the neighbors. Not only did this give us an additional data point, but also made us realize that there’s an informal sharing system amongst farmers in many Senegalese villages. This prompted all kinds of additional questions about how communities band together and what post-harvest crop loss might mean at a community level as well as an individual one.
Why It Counts
One of the huge benefits of this exercise is that you didn’t need a translator for the farmer to convey what he or she meant. By going visual, by going analog, and by creating a simple but powerful tool you can communicate pretty directly with someone whose language you don’t speak. And, as mentioned above, you’re entirely likely to stumble upon an idea or dynamic that you had no idea was even in play.
Best of all, you can adapt this method to any situation in which you want to see a visual representation of a percentage.